Low-lying areas around Tauranga’s coastal strip and harbour margins are vulnerable to flooding by the sea, especially during storm events.
Coastal and harbour inundation study
We’ve recently received updated coastal flooding modelling from Bay of Plenty Regional Council. This study investigates the potential for flooding along the coastal strip due to significant storm events and the effects of sea level rise.
The modelling, carried out by Earth Sciences New Zealand on behalf of Bay of Plenty Regional Council, combines updated regional coastal flood modelling with existing Tauranga Harbour inundation information and updated ground-level data. It replaces the 2019 harbour inundation maps previously held by Tauranga City Council.
You can view and explore the maps online. The map viewer allows you to search for a property and see areas that may be affected by coastal and harbour flooding under a range of storm event likelihoods and future sea-level rise scenarios.
Coastal and harbour inundation viewer
Bay of Plenty Coastal Flooding Explainer - YouTube
Information Flyer – coastal and harbour inundation (869kb pdf)
Contact us
This data is owned by the Bay of Plenty Regional Council. For this reason, Tauranga City Council is not legally allowed to make any changes to the data. If you have any questions or concerns about the data or maps, please contact Bay of Plenty Regional Council on 0800 884 880 or info@boprc.govt.nz.
For any other enquiries, please contact naturalhazards@tauranga.govt.nz.
What is coastal and harbour inundation?
Coastal and harbour inundation happens when an increase in sea level enables seawater to flood normally dry low-lying land. Typically driven by storms where low air pressure and strong winds driving large waves combine low-lying storm surge. This can be worsened by high or spring/king tides.
Climate induced sea level rise will increase the extent and frequency of flooding, eventually leading to sunny day flooding where flooding occurs with no storm. Find out more about predicted sea level rise around New Zealand. We’re continually working to identify areas in Tauranga likely to be affected by coastal flooding as sea level rises.
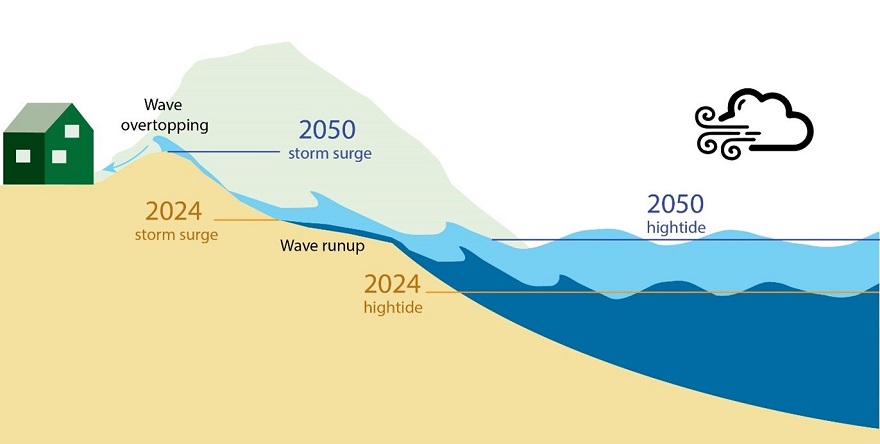
Schematic figure of how rising sea level will impact coastal flooding.
Coastal and harbour inundation in Tauranga
Tauranga has a long history of being impacted by large storms, the most significant of which are ex-tropical cyclones coming south. One of the most significant storms to affect Tauranga was ex-tropical Cyclone Giselle. This storm crossed the North Island on April 9, 1968, and travelled down the east coast of the country causing widespread damage as well as leading to the Wahine disaster. The storm generated a 0.88m high storm surge in Tauranga Harbour.
Over the last 30 years several other ex-tropical cyclones - such as Fergus (1997), Ivy (2008), and Pam (2015) - have also impacted the Bay of Plenty causing damage through coastal inundation, high winds, and heavy rainfall. On January 5, 2018, a low-pressure storm coincided with a king tide to produce flooding across Tauranga.
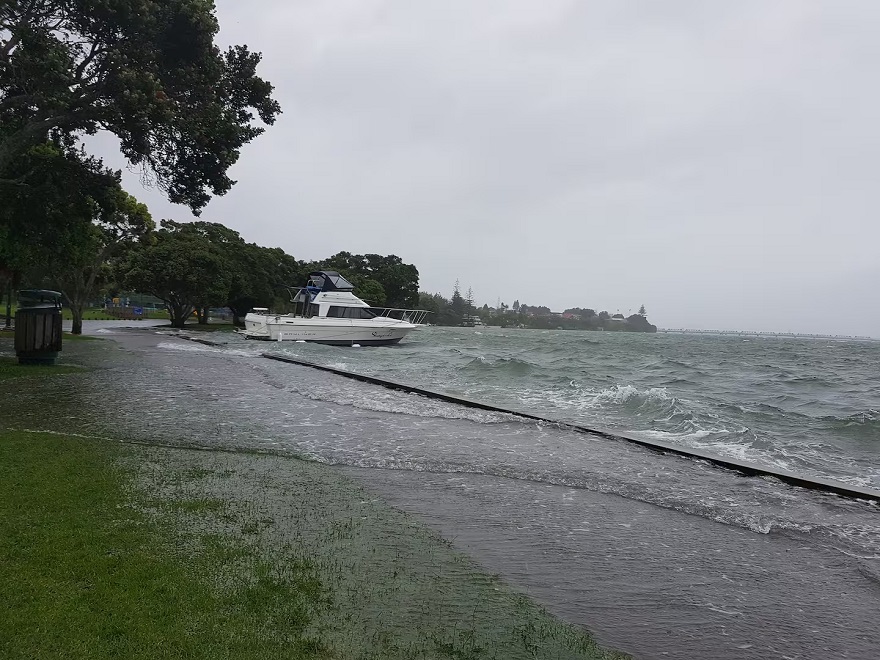
The sea flooding on to normally dry land at Memorial Park during a low-pressure storm in January 2018. Photo – Bay of Plenty Times.
Maps of coastal and harbour inundation
Coastal and harbour inundation maps identify land that may be affected by flooding from the sea during severe storm events, both under current sea levels and future sea level rise scenarios.
Coastal and harbour inundation maps are not a prediction of flooding. Modelling dynamic events such as storms is complex and requires specific inputs for tide, wind, and shoreline shape. Instead, the maps are an estimate of areas susceptible to flooding during storms at current sea level and as sea level rises.
In 2019, NIWA produced coastal inundation maps for Tauranga Harbour. In 2026, Bay of Plenty Regional Council commissioned Earth Sciences New Zealand to undertake updated coastal flood modelling for the wider Bay of Plenty coastline. For Tauranga, the updated coastal modelling was combined with the existing harbour inundation information and refined using the latest available LiDAR ground-level data to produce a single set of coastal and harbour inundation maps.
The modelling uses advanced computer simulations to calculate how tides, storm surge, waves, wind and rising sea levels interact to cause flooding. It also accounts for how floodwaters move across beaches, dunes, harbour margins and low-lying land.
For more information about the methods used to produce the maps and their limitations, see the technical reports below:
Latest study (Earth Sciences NZ, 2026)
Bay of Plenty Coastal Inudation 2026 full report (15mb pdf)
Previous studies
Options for managing coastal and harbour inundation
Approaches for TCC and property owners to manage coastal flooding can be through the following options or a combination of these:
- Avoid – preventing building and development in high risk locations to minimise exposure to coastal flooding. For example, through landuse planning and zoning.
- Accommodate – staying in place and adapting communities, buildings and infrastructure to increase resilience. For example, by raising floor levels of houses, managing stormwater and groundwater.
- Protect – staying in place and defending communities, buildings, and infrastructure usually through engineered solutions. For example, by building hard protection structures like seawalls or through natural solutions like dune and wetland management.
- Retreat – Moving communities, buildings and infrastructure away from high risk areas, either managed or otherwise. For example, through property sales or a managed retreat process.
Funding and support are available for community-led planning for a changing climate.