Our climate is changing. Over the next 100 years our city will need to respond to a range of social, cultural, economic and environmental challenges and opportunities presented by climate change.
Tauranga City Council commissioned a community carbon footprint for the city, looking at the 2015/16 financial year. This carbon footprint will help us understand how much greenhouse gas emissions our city discharges into the atmosphere, and where these come from. It is a first step to understanding what actions we could take to reduce the emissions that contribute to climate change. It will allow us to monitor change and the benefits of any action we take as a city.
We commissioned AECOM New Zealand for this work. The footprint followed a globally recognized methodology, which is used by cities around the world (the Global Protocol for Community Scale Greenhouse Gas Emissions Inventory).
How much greenhouse gases does Tauranga produce?
The research told us that as a city we discharged approximately 760,000 tonnes of CO2 equivalent (tCO2e) during the 2015/16 financial year, which is around 5.9 tCO2e per person. This is less than the national average per person of 17.8tCO2e (2014 figure) but more than some cities in New Zealand and across the world.
How do we compare to other cities?
In New Zealand: Tauranga’s emissions per person are lower than Auckland’s (7.9 tCO2e per person) and Dunedin’s (11.4 tCO2e per person). This is partly due to the lack of agricultural and industrial activities within the city boundary. On the other hand our emissions are higher than Wellington’s (5.7 tCO2e per person). We have a similar emissions profile to Wellington, but less agriculture emissions and higher transport emissions. Tauranga also gets lower emissions from air travel compared to Auckland and Wellington, due to the lack of international flights.
Around the world: globally speaking Tauranga’s emissions can be considered to be neither large nor small, with other cities having much lower (e.g. Stockholm and Copenhagen) and some much larger (e.g. Toronto and Sydney) emissions per person. These differences are due to a variety of reasons including the efficiency and uptake of public transport, the energy efficiency of the housing stock, population density, economic set-up (including the type and number of industries within the city), the energy generation mix and many more.
Where do our emissions come from?
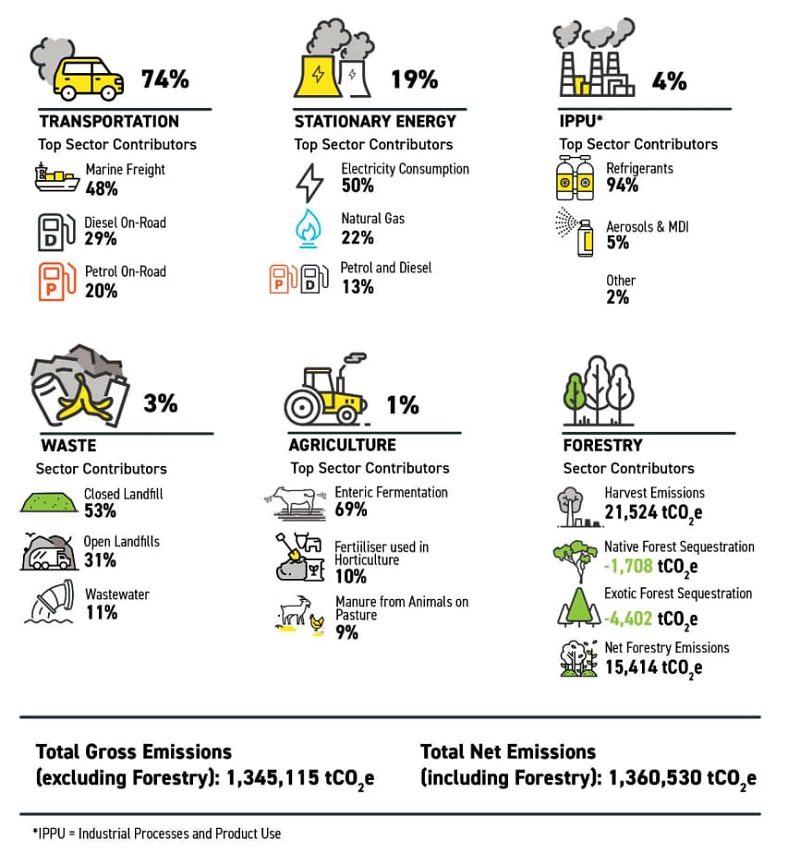
The vast majority of the city’s emissions are related to transportation (61%) followed by stationary energy (23%), waste (8%), industry (5%), agriculture (2%) and forestry (<1%). See further breakdown in the graph below.

Transportation
Includes emissions from petrol, diesel and LPG sold within the city boundary, as well as emissions from air travel and rail.
97% of transport emissions are from road transport, and come from the use of petrol, diesel and LPG for vehicle transport. Tauranga’s per capita emissions for transport are higher than Wellington’s and Dunedin’s, possibly due to lower records of commuter trips using public transport.
Stationary energy
Includes emissions from electricity consumed by residential, commercial and industrial users as well as consumption of coal, natural gas and biofuel such as wood.
The main source of emissions from stationary energy is from electricity consumed within the city: around 50%. Natural gas contributes a further 29% of stationary energy emissions.
Electricity consumption is also the dominant stationary energy emission source in other New Zealand cities. The contributions from other fuels vary somewhat depending on each city’s access to natural gas, LPG, coal and wood.
Waste sector emissions
These emissions are from the disposal of solid waste to landfills, composting of organic material and from treatment of wastewater.
In Tauranga waste emissions are generated mostly from solid waste sent to landfill (95%). Emissions from wastewater make up the remaining waste emissions. This breakdown is similar to other New Zealand cities.
Agricultural emissions
Includes emissions from livestock, crops and fertiliser use. Agricultural emissions in Tauranga (on a per person basis) are lower than the national average. While Tauranga does encompass some agricultural activities, most notably avocados and kiwifruit, horticultural activities result in significantly lower emissions than animal farming. Most of the agricultural emissions estimated within the city boundary (99%) are from farmed animals.
Forestry
Includes the emissions from harvested trees and the carbon sequestered in commercial exotic forests and other native forest cover. This is because trees store carbon dioxide as they grow, and release it when they are harvested, burnt or rot when they die.
Industry
Includes emissions associated with the use of industrial products for refrigeration, foam blowing, fire extinguishers, aerosols, metered dose inhalers and SF6 (sulfur hexafluoride). Emissions from industrial product use were estimated based on national data in our study due to lack of specific data for the city.
Limitations of the study
Where no Tauranga-specific data was available, the study used national or regional datasets and apportioned Tauranga’s share based on the most appropriate allocation matrix. For example, industrial emissions such as refrigerants used for air conditioning and heat pumps were estimated based on New Zealand’s average emissions per person.
Some emissions, however, could not be estimated or allocated to the city. For example no emissions were estimated for international shipping due to a lack of available fuel data and information on the origin or destination of the cargo flowing through the port. Emissions from shipping are likely to be significant and are worth considering for future inventories.
How this information will be used
The carbon footprint will be used to develop an Environment Strategy for the city, a piece of work currently underway. It will also be used to inform other strategies and plans e.g. transportation and as a baseline for us to monitor the effectiveness of our actions.
The Bay of Plenty Regional Council has also undertaken a carbon footprint for the whole Bay of Plenty, which will help us to understand our contributions from a regional perspective. More information on climate change from the Regional Council is available on their website.
Full reports
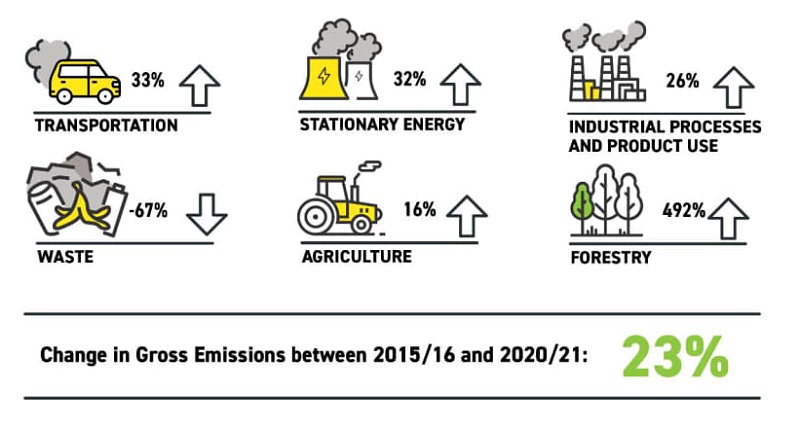
Tauranga Community Carbon Footprint 2015/16 (855kb pdf) Tauranga Community Carbon Footprint 2020/21 (2.3mb pdf)