As a city, we are working towards reducing our greenhouse gas emissions in line with national net-zero commitments.
Our climate is changing. Over the next 100 years, our city will need to respond to a range of social, cultural, economic and environmental challenges and opportunities presented by climate change.
TCC regularly measures the city's carbon footprint to help us understand how much greenhouse gas emissions our city discharges into the atmosphere, and where these come from. It is a first step to understanding what actions we could take to reduce the emissions that contribute to climate change. It allows us to monitor change and the benefits of any action we take as a city.
How much greenhouse gases does Tauranga produce?
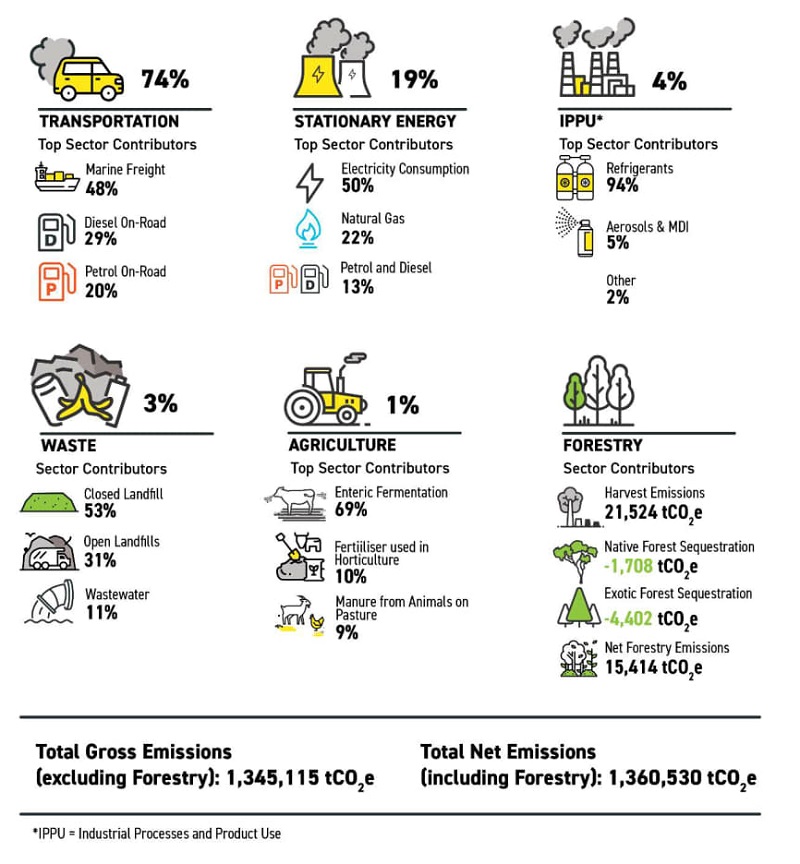
During the 2020/21 reporting period, we found Tauranga had gross emissions of 8.8 tCO2e per person. New Zealand has the 4th highest emissions per capita in the OECD (Source) – our emissions matter, and we’re not too small to make a difference.
Tauranga greenhouse gas emissions 2020/21

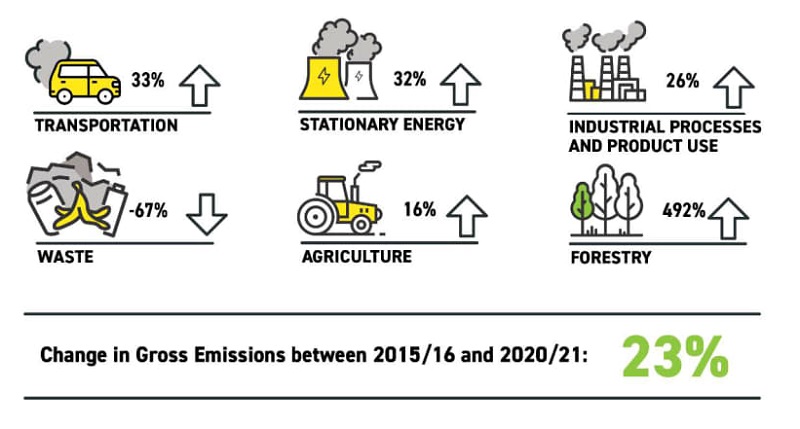
Tauranga greenhouse gas emissions percentage changes between 2015/16 and 2020/21

Where do our emissions come from?
- Transportation: Our city's transport emissions include emissions from petrol, diesel and LPG sold within the city boundary, as well as emissions from air travel and rail. For the first time, in 2020/2021, marine freight emissions were included in the inventory
- Stationary energy: Stationary energy was the second largest emissions sector. This accounts for the generation of electricity for use by industry, businesses and households and in the direct production of industrial heat
- Industrial processing: Energy used within all industrial settings (including, for example, food processing, chemicals, building and construction activities)
- Waste and wastewater: These emissions are from the disposal of solid waste to landfills, composting of organic material and from treatment of wastewater
- Agriculture: Includes emissions from livestock, crops and fertiliser use
- Forestry: This emissions footprint accounts for forest carbon stock changes from afforestation, reforestation, deforestation, and forest management.
Full reports
Tauranga Community Carbon Footprint 2020/21 (2.3mb pdf) Tauranga Community Carbon Footprint 2015/16 (855kb pdf)