To manage natural hazard risks, we have three planning maps that outline areas with varying levels of susceptibility landslides.
The city-wide mapping that Tauranga City Council holds on landslides are the slope hazard zones, landslide susceptibility map, and the relic slip database. Each of these assessments represent a district-wide, desktop-based study that doesn't capture site-specific conditions such as retaining walls, cut and fill slopes, drainage systems, or other slope modifications that could significantly affect actual landslide risk at individual properties. Therefore, you should consult a qualified geotechnical engineer prior to any modification of your slope to obtain site specific advice.
If your property appears on any of Tauranga's landslide maps, this doesn't mean your land is dangerous or that a landslide will definitely occur. These maps are planning tools designed to help identify areas that need extra consideration during development.
The mapping helps you understand your land's geological history and potential constraints early in any planning process. This can actually save you time and money by avoiding surprises later.
Many properties across Tauranga appear on one or more of these maps. Council staff and qualified professionals are available to help you understand what this means for your specific situation.
Key things to remember:
- Maps show possibility, not certainty - Being mapped doesn't mean a landslide will happen
- Early planning helps - Knowing about potential constraints early allows for better project planning and budgeting
- Professional advice is available - Qualified geotechnical engineers can provide site-specific advice tailored to your property and development plans
- Solutions exist - Even properties with landslide constraints can often be developed safely with appropriate engineers
Soil types in Tauranga
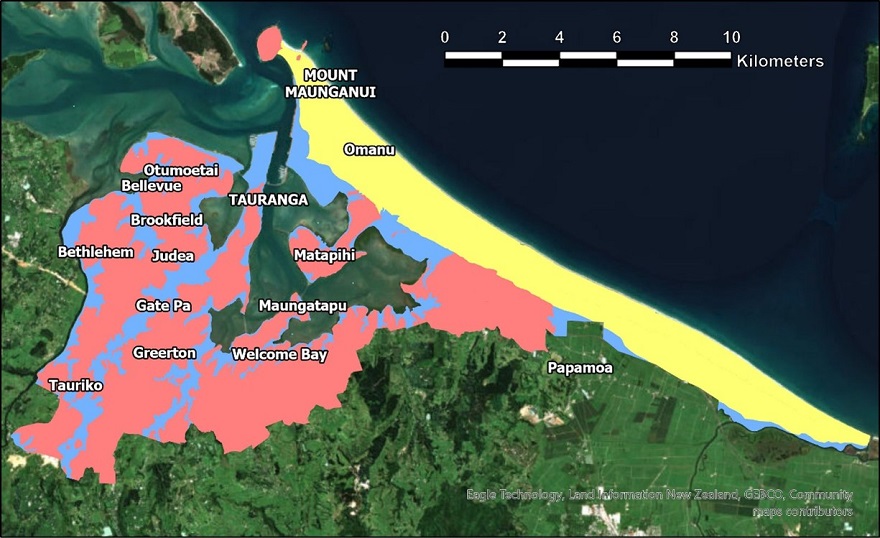
Tauranga is built across two distinct types of soil that control how landsliding occurs in the different areas.
To the west the city is built on layers of volcanic ash that form the peninsulas stretching into the harbour. This volcanic ash contains several layers that are prone to losing strength and slipping during prolonged or intense rainfall. The coastlines of the peninsulas are also prone to being eroded by waves which can result in slips.
To the east Tauranga is built on sands deposited as dunes have grown over the last 6,000 years. Natural slopes in sand generally forms at or near the angle of repose, that is the angle at which a heap of loose material will stand without slumping or sliding.
Volcanic ash soils are shown in red and dune sands in yellow in the map below. Blue shows the low-lying harbour margin and drainage channels that do not have slopes.
The difference in the types of soil Tauranga has been built on is accounted for in the landslide mapping that we hold.

Slope hazard zones
Slope hazard zones identify areas that could be impacted if a landslide occurs. These zones are based on the relationship between slope height and angle, drawing on decades of landslide research and observed patterns from historical events in Tauranga.
The zones don't predict where landslides will happen, but rather show areas that, if a landslide does occur, are likely to be affected based on how landslides typically behave in our local conditions.
How the mapping was developed
The slope hazard maps were originally published in 2003 and updated in 2023 and 2025, using modern high-resolution terrain data and engineering geology expertise. The 2023 update involved analysing detailed LiDAR elevation data captured in 2019, combined with a comprehensive review of Tauranga's geology, past landslide events, and slope characteristics. Engineering geologists used this data to map slope crests and toes throughout the city, then applied established slope angle relationships to define three distinct hazard zones based on decades of landslide research in the region.
The maps identify three key zones that could be impacted should a landslide occur.
- The failure zone shows areas where landslides typically begin, usually on moderately steep to steep slopes. /li>
- The regression zone indicates areas upslope of potential failure zones where land may become more vulnerable to landslides over time if initial failures are not properly remediated.
- The runout zone identifies land downslope that could be inundated with debris when landslides occur.
These zones are based on observed patterns from historical landslide events in Tauranga, including the significant May 2005 storm that triggered widespread slope failures across the city.

For property owners, being located within these mapped zones means additional geotechnical requirements apply for development and building consent applications. Properties in these areas will have notices added to their Land Information Memorandum (LIM) reports, and depending on the specific zone and proposed development, may require assessment by qualified geo-professionals before building consent can be granted.
It's important to understand that this mapping does not represent where landslides will happen, but rather zones that, if a landslide does occur, it is likely to be within these zones. The mapping was completed at a city-wide scale and should not be used for site-specific assessments, as actual landslide risk for individual properties requires detailed geotechnical investigation by qualified professionals who can assess local ground conditions, geology, and other site-specific factors.
Important limitations
- City-wide scale mapping - This mapping was completed at a city-wide scale and should not be used for site-specific assessments.
- Professional assessment required - Actual landslide risk for individual properties requires detailed geotechnical investigation by qualified professionals who can assess local ground conditions, geology, and other site-specific factors.
- Planning tool, not prediction - The zones help identify areas that need extra consideration during development, but don't predict when or where landslides will occur.
View slope hazard zones on Mapi
Tauranga Landslide Slope Hazard (IDC Zones) Study Technical Report 2023
Tauranga Landslide Slope Hazard (IDC Zones) Study Addendum Report: Mount Maunganui/Papamoa Update 2025