
Climate change will influence sea levels, weather patterns and rainfall intensity. These changes in turn will increase natural hazard risks such as flooding from extreme rainfall, inundation (flooding from the harbour/sea), erosion (coastal and inner harbour), tsunami and liquefaction.
Climate change and warming temperatures are causing sea level to rise, on average, by 3.5 mm per year. This sea level rise is caused by thermal expansion of the ocean, by melting glaciers, and by melting of the Greenland and Antarctic ice sheets. Sea level rise is going to have an increasing influence on our community over the coming decades and beyond. While there are many uncertainties about climate change, sea level rise and when rising seas will affect the existing hazards risks in Tauranga, it is clear from New Zealand and international research that there have been increases in sea levels across the world since the mid-1800s, and that this will continue well into the future.
Our role at council is to understand the challenges our city faces and work with our communities to reduce emissions while preparing for the effects of climate change.
Climate change webpage
Sea level rise scenarios
Researchers world-wide, including the Intergovernmental Panel on Climate Change (IPCC), had based their projections for sea level rise on four scenarios called Representative Concentration Pathways (RCPs), based on different greenhouse gas emissions levels: RCP2.6, RCP4.5, RCP6.0 and RCP8.5. This reflects the range of possibilities of how the world is going to manage greenhouse gas emissions, and therefore how the sea may respond.
In our research we take a range of future sea level rise scenarios into account. These scenarios are based on guidance from the New Zealand government on coastal hazards and climate change.
Guidance on Coastal Hazards and Climate Change - MFE 2024
Since our research has been undertaken, IPCC’s 6th Assessment Report (2021–22) shifted to a new set of future representative scenarios, based on Shared Socio-economic Pathways (SSPs). These comprise different socio-economic assumptions that drive future greenhouse gas emissions. SSP2-4.5 is equivalent to a world with moderate emissions (+2.7°C warmer world); this is the path we are on if we follow current policy settings. SSP5-8.5 is a worst-case scenario world with very high emissions (>4°C warmer world).
Parts of the guidance from the New Zealand government were updated in August 2022. The updates are based on the latest climate scenarios and new localised information on changes in land levels around the coast, known as vertical land movement (VLM).
Interim guidance on Coastal Hazards and Climate Change - MFE 2022
We are currently looking into how the interim guidance may influence our data and research to date.
Projections for New Zealand
The NZ SeaRise: Te Tai Pari O Aotearoa programme (NZ SeaRise) released location specific sea-level rise projections out to the year 2300 for every 2 km of the coast of Aotearoa New Zealand. These new national projections incorporate state-of-the-art information regarding future response of Earth’s large ice sheets, oceans, mountain glaciers and terrestrial water storage, as well as local non-climatic influences.
Local sea-level rise around the coast of New Zealand is affected by up and down movements of our land. Vertical land movement has a direct impact on local sea level along coastlines. In New Zealand some areas of the coastline are going up (uplift) and some parts are sinking (subsiding) on a daily, annual and long-term basis, irrespective of earthquakes.
The NZ SeaRise interactive tool allows exploration of sea-level rise projections around New Zealand. This is the first-time national projections of sea-level rise have taken into account vertical land movement.
NZ SeaRise interactive maps
A comparison of the 2022 sea level rise projections with 2017 coastal hazard guidance projections are shown in the graph and table below:
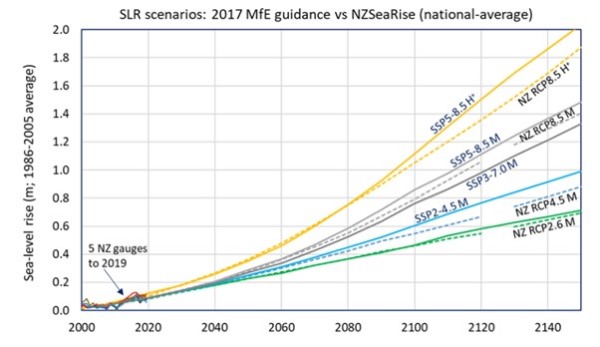
Source: Ministry for the Environment, August 222
| Scenario |
Sea-level rise from table 10 (MfE, 2017) (m) |
Latest national average sea-level rise by NZSeaRise (table 1) (m) |
Difference (m) |
| NZ RCP2.6 M |
0.55 |
0.58 |
0.03 ↑ |
| NZ RCP4.5 M |
0.67 |
0.77 |
0.10 ↑ |
| NZ RCP8.5 M |
1.06 |
1.11 |
0.05 ↑ |
| NZ RCP8.5 H+ |
1.36 |
1.50 |
0.14 ↑ |
Source: Ministry for the Environment, August 222
Projections for Tauranga
We commissioned NIWA in 2017 to develop sea level rise scenarios for Tauranga Harbour for the next 100 years, as well as assess prior storm events to better understand potential inundation in the future.
The projected sea level rise (NZVD 16) for Tauranga Harbour using four greenhouse gas concentration scenarios are below:
| Year |
NZ RCP2.6 (Median) |
NZ RCP4.5 (Median) |
NZ RCP8.5 (Median) |
NZ H+ |
| 1986-2005 |
0.07m |
0.07m |
0.07m |
0.07m |
| 2070 |
0.19m |
0.23m |
0.33m |
0.49m |
| 2130 |
0.47m |
0.61m |
1.05m |
1.39m |
You can read the detail in NIWA’s full analysis below. Please note, sea level rise projections in this report are presented as measured from Moturiki Vertical Datum 1953.
NIWA – Tauranga Harbour Extreme Sea Level Analysis (2017) (3mb pdf)